Solution 4.11
a) Present a statement showing which of the marketing managers proposals provide the greater amount of profit.
To answer this question one needs to know the number of packages sold in the current year. To calculate this figure one needs to use the information given on the current yerar. For example current year profit amount to 150,000 after fixed costs of 120,000 are deducted. That implies that current yea contribution is 270,000. If the current year contribution per package is 125 then the number of packages sold in the current year amounts to 2160 (270,000/125). Now one can prepare profit statements based on the marketing managers proposals.
|
Proposal 1 |
|
Proposal 2 |
|||||
|
|
|
||||||
|
Sales |
(250 x 2376) |
594,000 |
230 |
X 2700 |
621,000 |
||
|
Variable costs (135 x 2376) |
320,760 |
135 |
X 2700 |
364,500 |
|||
|
Contribution ( 115 x 2376) |
273,240 |
95 |
X 2700 |
256,500 |
|||
|
Fixed costs |
144,000 |
144,000 |
|||||
|
129,240 |
112,500 |
||||||
b) Calculate, in respect of each alternative, the break-even point in terms of sales volume and sales value
|
Proposal-1 |
Proposal 2 |
Fixed costs |
144000 |
144,000 |
Contribution per unit |
115 |
95 |
Break-even point (packages) |
= 1252 packages |
1515 = packages |
|
|
|
|
1252 x €250 |
1515 x €230 |
Break-even point (sales value) |
= €313,043 revenue |
= €348631 revenue |
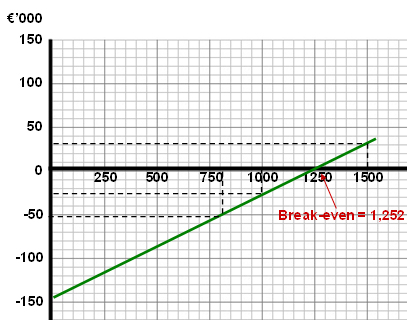
c) Prepare a profit volume chart based on the marketing managers first proposal and from the chart, estimate the profit or loss based on demand levels of 800, 1,000 and 1,500 packages sold
|
From the profit volume chart |
|||||||
|
800 packages |
-52,000 |
||||||
|
1000 packages |
-29,000 |
||||||
|
1500 packages |
28,500 |
||||||
d) Briefly outline four limitations of CVP analysis as a management information tool
As with any model, there are necessary, simplifying assumptions on which the whole model is based. These assumptions also represent the limitations of the CVP model. It is essential that managers, when interpreting CVP information, keep in mind these limitations and try to assess their influence in practical terms.
The assumptions are as follows:
- Revenue and cost behaviour are linear over the relevant range, i.e. they take the form of a straight-line on a chart.
- Variable costs per unit remain constant, thus ignoring the impact of quantity discounts.
- Variable costs are directly proportional to sales.
- Fixed costs remain constant within the relevant range.
- All costs can be classified into their fixed and variable components.
- Volume / activity levels are the only factors that influence costs. Clearly there are many other factors that influence revenues and costs such as quality of management and staff, industrial relations, economic conditions, working methods and conditions etc.
- Selling price per unit remains constant although economists point out that in order to sell additional units, selling price is normally reduced.
- The sales mix remains constant.